
The Nature of Groundwater Classroom Program

The Nature of Groundwater (TNoG) Introduction:
All hydrological elements in our Arizona landscape impact available groundwater. Participants in the Nature of Groundwater Classroom Program will explore the Arizona water cycle and unearth the local surface to groundwater connection within their watershed to deepen their understanding of how this intricate system works. Students will recognize human impacts to this system and be equipped with ways to act as water stewards in their communities to conserve groundwater and help keep it clean.
Unit Guiding Questions:
What is the nature of our relationship with groundwater?
Is this relationship built to last?
Four Fields of Study | Objectives:
WATER CYCLE – Model the components of the groundwater system and its relation to the water cycle and watershed.
GROUNDWATER – Comprehend the correlation between surface water and groundwater.
WATERSHED – Recognize that human activities within the watershed effect groundwater resources.
SUSTAINABILITY – Acknowledge the significance of groundwater health and sustainability.
Before you start the unit:
Have students take the Pre Student Survey.
You can find the entire The Nature of Groundwater Program Curriculum PDF Here
Anchoring Phenomena - Clouds (optional intro activity):
How to make a cloud video
Engage: Pause the video at 0:55 to have the students try it for themselves. You can end the video at 2:28.
Take some time to discuss what you saw in the video. Give the students a chance to think about how water moves and changes form. Ask them to write down three questions that they have about the phenomena. If you are able to give the students sticky notes - create a public board of questions to refer back to during the unit.
Explore: Invite students to observe clouds and participate in a Cloud Scavenger Hunt over the course of the unit.
Explain: Use the linked websites to learn about clouds, investigate how they are formed and which ones we see most often in the Arizona sky. Use Clouds Notes organizer to obtain, evaluate and use information to make an argument from evidence.
Elaborate:
Make a Cloud in a Bottle
https://www.jpl.nasa.gov/edu/resources/project/make-a-cloud-in-a-bottle/
NASA Jet Propulsion Laboratory Citizen Science Student Project https://www.jpl.nasa.gov/edu/resources/project/the-types-of-clouds-and-what-they-mean-2/
Anchoring Phenomena: Clouds Lesson Plan
Investigative Question:
- What are clouds?
- How and why do clouds form?
Reference:
https://www.noaa.gov/jetstream/clouds
https://scied.ucar.edu/learning-zone/clouds/cloud-types
https://www.weather.gov/source/zhu/ZHU_Training_Page/clouds/cloud_development/clouds.htm
Time Frame: 50 minutes
Cross Cutting Concepts Demonstrated:
- Cause and effect
- Matter and energy
- Stability and change
Science and Engineering Practices Integrated:
- Ask questions and define Problems
- Obtain, evaluate, and communicate information
- Engage in argument from evidence
Materials Needed:
- Clouds scavenger hunt
- Clouds Notes Page
- Websites
Downloads:
- Document
- Document
- Document
End of Unit - Lesson Anchoring Phenomena
Sustainability and Stewardship
PBL Opportunity - If you have time to do a solutions project, choose the phenomena you think best suits your project. You could talk about droughts, floods, changes in the Colorado or local rivers, groundwater overuse or pollution, desalination, water reclamation, or water purification.
https://www.arizonawaterfacts.com/do-we-have-enough
https://www.arizonawaterfacts.com/tips-resources
Water Cycle & The Incredible Journey
Entire PDF can be found here
Investigative Question:
- How does water move and change form in the earth’s natural system?
- What are the forces that drive the water cycle?
- How does groundwater fit within the Arizona Water Cycle?
Activate: Students describe the movement of water within the water cycle and identify the states of water as it moves through the water cycle as the play a game where they take on the role of a water molecule. With a roll of cube or spin of a dial, students simulate the movement of water within the water cycle, realizing that groundwater is part of it and that it is much more like a water web.
Check: Students discuss in small groups or as a class their incredible unique journey as a water molecule and are able to label their water cycle diagram.
Reference: adapted from “The Incredible Journey”, Project WET Curriculum & Activity Guide 2.0, 2nd edition, 2011, pg. 155-162 and “Thirsty Plants,” Project WET Curriculum and Activity Guide, 1st edition, 1995, pg. 116-121.
Cross Cutting Concepts Demonstrated:
Energy & Matter
Cause and effect
Systems & System Models
Science and Engineering Practices Integrated:
develop and use models
engage in argument from evidence
ask questions & define problems
use math & computational thinking
Slides for Water Cycle & The Incredible Journey:
Materials Needed:
- Water cycle table & cube patterns
- Copy of Spinner Wheel Incredible Journey Option
- Water cycle narrative
- 9 dice or spinner wheel
- 9 bead cups/containers with different colored beads
- 9 station signs
- Chenille Stems looped at one end (enough for each student)
Additional Materials & Resources:
- Thirsty Plant Data Sheet
- Capillary Action Video
- https://phet.colorado.edu/sims/html/states-of-matter-basics/latest/states-of-matter-basics_en.html
- Molecules In Motion Simulation Worksheet
- Why Does Ice Float Video
- https://www.usgs.gov/special-topics/water-science-school/science/adhesion-and-cohesion-water
https://www.usgs.gov/special-topics/water-science-school/science/water-cycle
Water Cycle & The Incredible Journey Activity
Engage: Prompt students to think about where water can be found in the natural system (lakes, rivers, plants, etc.). Where is the liquid form of water? Where is the gaseous form of water? Where is the solid form of water? What causes water (matter) to change from a solid to a liquid to a gas? - (Energy from the sun). What causes water vapor to precipitate and fall from the sky and percolate into the ground? (Gravity). Ask students to share their ideas and discuss in small groups. Generate a class list on the board/smartboard/poster board.
Explore: Use this narrative lesson to help introduce vocabulary and hand motions that go along with it. Then play the game and share their journey verbally or by writing a story.
Explain: Learn key vocabulary. Play the Gimkit for review.
Water-Cycle-Vocabulary-Definition-Example-Drawing.pdf
Evaluate: Ask student to complete the water cycle work sheet and you can give the quiz.
Elaborate: Additional Activity & Resources
Thirsty Plants Activity
Thirsty Plant Set-up:
Thirsty Plants Activity – this activity can also be done at home using the thirsty plants data sheet.
- Give each student an empty plastic bag. Have students examine their bag and record any observations. See above.
- Take students outside to an area with several plants (a variety of types is nice, and sunny areas work best). Have students carefully place the bag over several leaves of their plant (try for 2 or 3). (You may want to have a few larger plastic bags on hand for some groups who choose large trees or plants with large leaves.) Each student should count and record the number leaves in their bag, record the time, and then take a moment to estimate the total number of leaves on the plant.
- Back in the classroom, have students predict what they think will happen and write down their predictions.
- Wait to collect the bags for approx. 60 minutes, or whatever time frame works for your class. (This is a good time to move on with the rest of the earth material section of the lesson while you wait for your experiment and then complete this after).
Thirsty Plants – Finish activity: (after bags have been in sun for at least an hour)
- Have students carefully remove the bag from the plant, leaving the leaves in place. Have students take one leaf from the plant/tree they had their bag on for identification. Make observations about how much water is in the bag. Have students hold up their bags showing how much water was collected in each bag.
- Have students do a gallery walk, comparing how much water is in each bag and the plant type and leaf size. What claims can they make based on evidence? Ask students: Where did the water come from and how did it get there? Show the diagram in slides.
- Ask students: What form of water goes into the roots? Liquid. What form of water is in a plant? Liquid. During the day, increased heat energy will cause water to move into a pore in the stoma. What causes the heat energy? The sun. It is the driver of water moving through a plant. So, what is not in this diagram that is needed? The sun. When the water molecule leaves the pore, what form do you think the water is in? Gas or vapor. Would you be able to see it? No, it’s invisible to the eye now. Explain that during this process, water molecules change form from liquid to gas or vapor when the molecules leave a plant. Do you know what this process is called? Transpiration. When the Sun heats up the water molecule on the plant’s surface and changes it to a gas it also pulls the next molecules up through the plant. This is called capillary action and happens because water sticks to itself and to other things. This is an important property of water. Show students the Capillary Action section of the earth material video as an example of what it looks like- https://youtu.be/_KEjB-u4dQo.
- Have students answer these questions: How many leaves were in your bag? How many leaves did you estimate were on your tree? How much water do you think would come from the entire tree in that same time? How about all the trees in your neighborhood? Do you think transpiration plays an important role in the water cycle?
Full-Body Simulation – How Water Behaves: Developing and Using a Model
Students will simulate the cause-and-effect relationships between water molecules and energy. Heat is a form of energy. Through the Anchor Phenomena Demonstration and the above investigations, students should have some prior knowledge about the relationships between water molecules and heat energy.
- Ask students: Let’s think about what form water is in, when it’s affected by a lot of heat. First, what is heat again? Heat is energy. So, when water molecules have the most energy, what do you think they look like? They are moving fast! What form are they in? Gas.
- Ask students: Where is water in gas form? Can you see it? It is right here in the room in front of us, but you can’t see it.
- Tell the class they are going to become water molecules. They will begin as water in its gas form. Ask students: How do you think you should behave as molecules in gas form? In its gaseous state, water molecules move freely. Students should move quickly around the room waving hands and wiggling fingers.
- Ask students: Over time, some heat energy is lost. What will happen to all of you water molecules? Water molecules will not move as fast. They will not have as much energy. Students should slow down a little.
- Tell students they are now liquid. As a liquid, they begin bonding with other molecules and letting go (they do this by putting a hand on a neighbor’s shoulder and letting go and then moving on to another). They are still moving fairly quickly as warm water.
- As more heat it lost, water becomes room temperature, and students’ movements should slow some more. Tell them they are lethargically bonding and letting go.
- As even more heat is lost, the liquid water becomes cold. Ask students: What do you think happens? They slow even more and should get very close together like they observed the cold water behave in the vial.
- Ask students: What happens when water molecules get very, very cold? They turn to ice. How should we demonstrate that? They may think that they should get very close together. But at 4 degrees C, water does an amazing thing. It begins to expand in to ice. Have students in groups of 6 put a hand on their neighbors’ shoulder and stiffen their arms to make a hexagonal (6-sided) shape representing the structure of water molecules in a frozen state. As a liquid, water molecules will continually bond and let go. As ice, water molecules stay bonded making a structure.
- Ask students: Now that you are ice are you closer together or farther apart than when you were a very cold liquid? Farther apart. What do you think would happen if we put ice in room temperature water? Let them predict but do not give the answer.
- Have students gather around a table with a cup of room temperature water and add an ice cube. Have students observe what happens. What is the ice doing? Floating! Water molecules turn solid in ice form and spread out creating more space in between making them float on liquid water. Therefore, ice water floats while the cold water stays on the bottom.
Online Simulation - cause-and-effect relationships between water molecules and heat energy
Students will use an online simulation to visualize the cause-and-effect relationships between water molecules and heat energy.
1) Have students go to: https://phet.colorado.edu/sims/html/states-of-matter- basics/latest/states-of-matter-basics_en.html
2) Students should complete the worksheet (Molecules in Motion Simulation Worksheet while moving through the instructions.
Wrap-Up:
Have students go back to their questions from the warm up. Have them write answers to questions they can answer. Ask students: What are the cause and effect relationships between heat and water molecules? Use sentence starters: 1) When heat is added to liquid water… water molecules get lots of energy and can drift off and become a gas. 2) When heat is added to solid water… water molecules get more energy and move out of a 6-sided structure to become a liquid. What is the heat source or energy in the water cycle? The sun which is a source of heat energy. Make sure they have the sun labeled on their water cycle diagram.
WATERSHEDS WORK & HUMAN IMPACTS
Entire PDF can be found here
Investigative Question:
- How do we manage a watershed to make sure our water is clean and sustainable?
- How do the parts of a watershed interact with the water cycle and groundwater?
Activate: Students use maps and modeling to characterize what a watershed is; to identify the key parts and functions of watersheds; to determine watershed boundaries; to describe how water flows in a watershed. Through this simulation students discuss what happens to the quality of water in an urban environment.
Check: Students make conclusive claims about impermeable and permeable surfaces and discuss possible solutions to these human-caused problems.
Reference: adapted from “Seeing Watersheds,” Project WET Curriculum and Activity Guide 2.0, 2nd edition, 2011, pg. 187-202.
Cross Cutting Concepts Demonstrated:
Cause and effect
Systems and System Models
Stability and change
Science and Engineering Practices Integrated:
Ask questions and define Problems
Analyze and interpret data
Engage in argument from evidence
Develop and use models
Construct explanations and design solutions
Lesson Slides - Watersheds Work & Human Impacts:
Materials Needed:
Spray bottles
2 pieces of 8-1/2 by 11 white paper per student (scrap paper can be used if blank on one side) or large pieces of butcher paper/poster paper (2 per table group)
Water soluble markers (green, blue, brown, red, purple)
Scotch Tape
Other Resources:
- Health and Function of Arizona Watersheds
- PBS Watershed Resources
- https://www.usgs.gov/water-science-school/surface-water
- AZ STORM - Stormwater 101
- Salt River Project Tour - Arizona Project WET creation
- Audubon Southwest and The Nature Conservancy in Arizona StoryMAP: Exploring the Verde River Watershed
Watersheds Work
Warm Up:
Feel free to use the slides provided above. Ask students: What is a watershed? Split the word in two and ask, what is water? (we are just looking for a simple definition here). What is a shed? They will likely know that sheds store something. What does a watershed store? Water. Then, think about shed as a verb. What does it mean to shed? They will likely be able to relate the word to a pet. A pet sheds hair. What do you think watersheds shed? Water. We relate this to water running off the land. Do you think a watershed looks like a toolshed? No.
A watershed is a land area that drains to the low points. What marks the edge or boundary of a watershed? The high points or mountains. What are the low points? The rivers or valleys that may become rivers when it rains. When managing a watershed, we are managing both the land and water … everything within the boundaries.
Investigation Activity:
We are going to make a model of a land area.
Put a piece of 8 ½ by 11 white paper down on the table in front of you (blank side up if using scrap paper) or one piece of large poster paper if doing this as a group.
Crumple the second piece of 8 ½ by 11 white paper (blank side facing out if using scrap paper), or second piece of large poster paper if doing this as a group.
Un-crumple the paper until you can find all four corners, it should not be perfectly flat.
Tape all four corners of the crumpled paper onto the flat piece of paper in front of you. Leave the crumpled paper as high as you want. It should now look like mountains or a raised relief map.
Using water soluble markers, draw symbols that represent different features on your relief map using the following key:
Green marker to draw a line along all the ridges (the up folded areas).
Blue marker to draw a line along all the valleys (the down folded areas).
Red marker to indicate any abandoned mines with a * symbol.
Purple marker to indicate cities with a # symbol.
Brown marker to indicate a farm with a colored-in area.
You have made a model of the land surface or a raised relief model.
Predict how water is going to flow on your model when we spray them with water. What direction will water flow? Why?
Are there areas on your model that have no outlet and will store water?
Have students take their models outside where they will spray their model with a spray bottle, in other words they are going to make it rain!
While Outside: Have students form a circle and place their models in front of them toward the middle of the circle. Share spray bottles and give all students time to make it rain on their models. After students have sprayed their models, ask students to recall the definition of a watershed. What is the edge or boundary of a watershed? The high points. What color are the high points on the model or map that you made? Green.
What are the parts of your watershed? Have them point out their answers on their maps. The water, the city, the farm, high points, low points, etc. What is the white area? If they don’t know, ask: What is the definition of a watershed? Give them time to think about this. The white is the land area. What could be on the land area other than cities, old mines and farms? Forests, deserts etc.
Do a circular gallery walk so that students can view other students’ models. How are they the same? How are they different?
Discuss each of the following questions with your students. Did any of your cities flood? If there was pollution on your city streets, could it get into your farm field? Could excess pesticide or fertilizers from your farms go into your cities? Could old mines affect water coming into cities or farms?
What is a watershed again? Do you think you live in a watershed? Yes, we all live in a watershed.
What is a watershed a part of? Give them time to think about this, talking with the person next to them. A landscape or bigger land area, our community, our water supply. It can also be a part of another watershed.
Alternatively, students can watch the watershed video to learn how to make their own watershed model at home or teachers can use the video to facilitate the lesson. This video describes the parts of the watershed and uses systems thinking to think deeper about the watershed. https://youtu.be/_zFM9mYg05w
Watersheds Work & Human Impacts (Additional Materials & Resources)
Investigative Question:
- How does human impact on the land affect water and heat within a watershed?
- How can we reduce urban runoff and the flow of contaminants from going into our watersheds and groundwater?
Explore:
- Students explore the topics of permeable and impermeable surfaces, the urban heat island effect and pollutants from runoff to better understand how humans can impact the flow of water and the temperature within an urban watershed. Students investigate their school grounds during a scavenger hunt identifying different surfaces, possible pollutants and recording temperature of surfaces with a heat gun (or by touch).
- Students participate in a whole-body simulation of urban runoff in a storm drain system and discuss what happens to the quality of water in an urban environment.
Explain: Have students share their findings with the class and generate a list of observations. Ask students to make a claim based on the evidence they have gathered to support or refute the claim: Human choices can affect the amount of heat and pollution in a watershed.
Elaborate:
- Ask students to design an investigation to explore something else they would like to learn about watersheds.
- Ask students to design a solution to reduce increases in heat absorption or pollution in watersheds.
Evaluate: Evidence-based arguments for and against the claim: Human choices can affect the amount of heat and pollution in a watershed.
And/or play vocabulary Gimkit and/or give vocabulary quiz.
Reference: adapted from “A-maze-ing Water” Warm Up and Activity Option 1, Project WET Curriculum and Activity Guide 2.0, 2nd edition, 2011, pg. 231-238. Worksheet created by staff.
Materials Needed:
Each water festival group will need:
- Runoff & Heat Scavenger Hunt Worksheet Primary Grades for each student (handout) or Worksheet for Older Grades
- Clipboards (one for each group if possible)
- Temperature gun (optional) or use touch to feel the difference
- Chalk (for outside) or 10-15 chairs (for inside option)
- Sticky notes or other materials to represent pollutants found in urban runoff
- Can or bottle labeled “chemicals” or “oil” (optional)
- Urban-Stormwater-Vocabulary-Definition-Example-Drawing.pdf
- Urban Watersheds -Vocabulary-Quiz.pdf
Human Impacts Activity:
Warm Up:
- Use the slides provided here to introduce or review with your students some urban watershed topics.
- Have students define what a permeable landscape is and how water behaves on a permeable surface - water soaks or infiltrates into the soil. Once in the soil, it can go into plants or keep traveling further to reach groundwater. Some water also evaporates. Have students write down examples of permeable landscapes in their notebooks.
- Have students define what an impermeable landscape is and how water behaves on an impermeable surface - water stays on the surface or runs off. Water can also evaporate. Have students write down examples of impermeable landscapes.
- Have students define what the urban heat island effect is and how water behaves in this landscape – there may be less rain overall because of the heat dome or if there is rain there is more runoff that can’t soak in. Water can also evaporate faster. Have students write down examples of things that might increase heat (pavement, buildings, AC units, cars) or suggest things that might cool down the urban environment (trees).
- Show students a can or bottle labeled “chemicals” or “oil”. Tell them that you need to dispose of the chemicals and that you plan to dump them in the street in front of the school. Ask students if they think this is a good idea. Have them describe what they think will happen to the waste material.
• Read the paragraph below – storm water scenario. Ask students what they think might happen to the runoff.
Storm Water Scenario:
Imagine the parking lot of a large shopping center. Every year, thousands of cars park in the lot, each depositing a small amount of engine oil and grit (loosened road materials). A gentle rain begins to wash the lot. At the parking lot’s lowest point oil-and gas-tainted runoff water begins to flow into the street gutter. A few blocks away, an urban river flows, filled with floating debris, sediment and multicolored water from another street, then another and another. The flow now nearly fills a ditch constructed to channel urban runoff. From a distance, the storm water in the drainage system appears dark-colored. Perhaps the road salt used in the winter to melt ice on roads and sidewalks has mixed in. How about the paint a neighbor poured into the gutter? The pet waste near the sidewalk? Woosh more water moves by! What next? What will happen to the nearby stream and the people using water downstream for their water supply?
Activity 1 – Runoff & Heat Investigation:
- Break students into small groups and give each student their own worksheet. If you don’t have many clipboards, have only one student from each group take their paper outside, and then have the rest of the group record the data when you get back into the classroom. Students in each group can take turns being the recorder.
- Explain to the class that you will be going around the school campus looking at different surfaces (permeable and impermeable). It would be best if they try to find at least one surface of each and one that is in the sun and the shade so they can make some contrasting observations.
- Students also should be recording the temperature of the surface with the temperature gun and listing any possible pollutants they might find.
- Once back in the classroom, students can share the info they collected so that everyone can record the data on their own sheet. Then students turn the page over and answer the other questions. You can also facilitate this as a class discussion.
- Which surface was hottest, why? Was it permeable or impermeable? Does this surface add more heat and pollutants to our cities?
- Which surface was coolest, why? Was it permeable or impermeable? Does this surface help cool down our cities and maybe reduce pollutants?
- What are things you and your family can do to help keep our cities cooler and to protect our water
Activity 2 - Full-body simulation of urban runoff in a storm drain system:
- Review how water is used to clean things, such as the surface of a table after a spill. Relate how rainwater “washes” the outdoors. Explain again that as it flows over plants, soil and sidewalks, water picks up and carries away soil and other materials. Often the water goes down storm drains, runs through pipes and flows to a stream, river or ocean.
- Draw a simple but large maze on the school blacktop (see possible example) or arrange the chairs in the classroom to form a maze. The maze represents underground pipes that collect and transport surface water that has flowed down storm drains. Have students go through the maze. Inform them that they are water flowing through the drainage pipes to the river.
- Discuss again where the water comes from that runs into the storm drain system. (Streets, lawns, parking lots and so forth). What might this water carry? (Oil from cars, fertilizers, trash).
- To simulate surface water transporting pollutants into drainage areas, have several students position themselves along the sides of the maze. They represent storm drains through which contaminated water flows. Provide them with sticky-notes to use as pollutants. When students run through the maze, the storm drain students affix sticky-notes to them; this denotes contaminated water mixing with other water (that may or may not be clean) flowing through the system. Allow students to take turns playing different roles.
- After students make several trips through the maze, discuss what happens to this dirty water. What if it flows into the river? Have students summarize ways to reduce waste and pollutants.
Wrap up:
Discuss the problems associated with untreated urban runoff entering rivers or other bodies of water. Let students share ideas they have of ways they can help reduce the effects of the urban heat island and reduce pollutants from entering our storm drain systems within our watersheds. Ask: Who is responsible for taking care of and managing the watersheds we live in? Each of us are responsible. It is up to all of us! In the coming lessons we will dive deeper into sustainable solutions and actions students can take.
If you would like access to the whole A-maze-ing Water lesson from 2.0 Guide click below.
• Link to PDF of entire A-maze-ing Water Lesson from Project WET 2.0 Book (need password to download it – ArizonaPW)
Here is also the webpage where I got the heat maps and tree cover maps – here.
GROUDNWATER & SUSTAINABILITY
Entire PDF can be found here
Intro to Groundwater and Water Movement Between Earth Systems:
Investigative Question:
- How and why does water move between Earth’s systems?
- What are some of the consequences of water movement (cause and effect)?
Explore:
- Students do a whole-body simulation to model the movement of liquid water through different earth materials.
- Students experiment with different earth materials and how water moves through each.
- Students use an online simulation to visualize how water moves through different materials.
Reference: Adaptation from “Get the Groundwater Picture” Part 2, Project WET Curriculum & Activity Guide 2.0, 2nd edition, 2011, pg. 143-154.
Cross Cutting Concepts Demonstrated:
Cause and effect
Systems & System Models
Science and Engineering Practices Integrated:
Ask questions and define Problems
Analyze and interpret data
construct explanations
Slides for Groundwater & Sustainability:
Materials & Digital Resources Needed:
- Clear plastic cup for each student/or group (could be something out of recycle bin) filled with different earth materials of your choosing
- water
- You can also use this online simulation - https://has.concord.org/groundwater-movement.html
- Whole Body instructions video can be found here: https://youtu.be/AnoSFw0_Xvc
- How water moves through earth materials video and demonstrating capillary action https://youtu.be/_KEjB-u4dQo
https://groundwater.org/awesome-aquifer/ Lesson 3 & 4
Warm Up:
Feel free to use the slides provided above to introduce this lesson. Ask students: Where can water go from the soil? Hopefully, this makes them think downward and to groundwater, though they may have no prior knowledge of groundwater. How does water get into the ground? Let them know that they’ll also be exploring groundwater’s movement through earth materials today.
Earth Materials Modeling - Whole Body Simulation
- Ask students: What do we mean by earth materials? Rocks of various sizes down in the earth.
- Select ¼ of the students in the class to act as water molecules. The rest of the students will represent earth materials.
- Round 1- Water Movement through Gravel: Students become gravel by stretching their arms out away from their bodies. Students should be able to rotate all the way around and touch only the tips of other students’ fingers. Students should then drop their hands to their sides. The students representing water molecules will start on one side and move (flow) all the way through students representing gravel to the other side (see page 145 in PW 2.0 book). The water molecules are moving down due to gravity through the earth materials. Say “on your mark, get set, go” and time how long it takes the water molecule students to move through the gravel. Record the time.
- Round 2- Water Movement through Sand: Choose a different ¼ of the students to act as water molecules. Students become sand by putting their hands on their hips and rotating all the way around so that only the tips of other students’ elbows touch. Students should then drop their hands to their sides. The goal of the students representing water molecules is to move (flow) all the way through students representing sand from one side to the other (see page 145 in PW 2.0 book). Say “on your mark, get set, go” and time how long it takes the water molecule students to move through the sand. Record the time.
- Round 3- Water Movement through Clay: Choose a different ¼ of the students to act as water molecules. Students become clay by keeping their arms at their sides and standing shoulder to shoulder. The goal of the students representing water molecules is to move (flow) through students representing clay (see page 145 in PW 2.0 book). But there are not many pathways. This simulates water trying to move into clay. Tell them the clay may keep the water from going through at all. Over a long period of time water can soak in between the fine plates of clay. But in normal time frames, clay acts as an impermeable layer. Stop the simulation there.
Earth Materials Video:
Show students the video of water moving through different earth materials https://youtu.be/_KEjB-u4dQo. The first part of the video demonstrates capillary action in transpiration. At 3:30 minutes the percolation experiment starts. You can also use this online simulation - https://has.concord.org/groundwater-movement.html. Have students discuss or write about how water moved through each earth material and what that means in regard to transpiration and percolation.
Earth Materials Experiment: Can be demonstrated with Amazing Aquifer Kits if you have them: https://groundwater.org/awesome-aquifer/ Lesson 3 & 4
- Have each student/or group find a cup that will allow for holes to be poked on the bottom. A clear plastic cup is preferable.
- Students should make holes in the bottom of their cup, about a dozen of them. Tip: a thumbtack/push pin makes a great tool to make the initial hole then using the tip of a pen to enlarge the hole, but students may need assistance from an adult if they need to use a sharper object.
- Students should identify and fill the cup with any earth material from an outdoor area (examples - gravel for a tank or landscape, sand for a sandbox, etc.). They should collect it from only one area or one type of material.
- If students will do the experiment in the classroom, have containers to catch the draining water, as well as a container of water and a towel in case of spills. Otherwise conduct the experiment outside.
- Have students discuss what their earth material looks like, the size, observations, etc. Have students pour their water in their cup. You can have them count all together and then report after the experiment how many seconds it took for the water to go through.
- Create a data table to record the type of material and how long it took the water to move through it as you do the experiment with students. Discuss with students where the water was as it moved through (in the pore spaces) and compare their observations. Did the size of the earth material make a difference for how fast the water moved through?
Discuss the results. Ask students to describe how water moves through the earth materials and discuss why?
Does it move through the pieces of gravel themselves? No, it moves through the spaces. Which earth materials did water move through the fastest? Gravel Why? The spaces were bigger. We call these spaces between earth materials pore spaces. When water moves through spaces in rocks, we say they are permeable. What do you think permeable means? Water can move through it. When we think of water moving into the clay what happens? It cannot get through. What do you think we call this clay layer? Impermeable. Can you summarize what we know from the simulation? Water moves through some earth materials and not through others.
Deep Dive into Groundwater:
Investigative Questions:
- What is the relationship between groundwater and surface water?
- What is the nature of our relationship with groundwater? Is this relationship built to last?
Reference: adapted from “San Pedro Connection,” Arizona Conserve Water Educator’s Guide, 2007, pg. 71-90 and staff created materials.
Time Frame: 50 minutes
Cross Cutting Concepts Demonstrated:
- cause and effect
- systems and system models
- stability and change
Science and Engineering Practices Integrated:
- analyze and interpret data
- engage in argument from evidence
- ask questions and define problems
- construct explanations
Materials Needed:
- Arizona Groundwater Videos
- Groundwater Diagram Worksheet
Amazing Aquifer Kits or other models - https://groundwater.org/awesome-aquifer/
Amazing Aquifers
Warm Up
Use the Amazing Aquifer Kits or other models and slides above to introduce some new facts for this lesson: https://groundwater.org/awesome-aquifer/
Groundwater is the largest source of fresh water on Earth – it’s kind of a big deal! In fact, there is over a thousand times more water in the ground than is in all the world’s rivers and lakes.
- Most of Arizona’s water supply comes from groundwater – 41%.
- Ask: What does groundwater begin as again? Where does it come from? Precipitation (snow or rain). Then it runs off the land until it can find places to soak down through materials or adds to surface water.
- Have students write in their notebooks what is groundwater – water in the ground that fully saturates or fills up the pores or cracks in soils, sand and rocks. Can they draw a picture of it?
- How do we get to and use groundwater? We use wells to pump it up.
- If you live in Arizona then you are probably using groundwater! But do different places in Arizona have different amounts of groundwater? Yes, just like surface water, groundwater is not distributed equally over the state.
- Can we just keep pumping and taking all the groundwater that we want? Why or why not?
- Pumping groundwater at a faster rate than it can be recharged can have some negative effects on the environment and the people who use that water. We call this overdraft.
- Lowering the water table – the level below which the ground is saturated with water can be lowered. This can cause shallow wells to dry up and forcing others to dig deeper.
- We also learned at the festival that if we over pump and take too much groundwater, it can reduce the amount of water in our streams, rivers and lakes and even cause them to dry up.
- We can also cause damage to the land in the form of sink holes, fissures, and land subsidence. When land subsides, it loses its capacity to hold groundwater in the future.
- What did the state of Arizona do to help control the use of groundwater? We passed the 1980 Groundwater Management Act. It created Active Management Areas (AMAs), which introduced regulation and conservation measures in parts of the state with a history of heavy reliance on groundwater.
- Phoenix and Tucson are both trying to achieve safe-yield – which means the amount being taken is the same amount being replaced annually… they are still working on this. Cities do this by recharging the aquifer. We usually use surface water to do this which normally comes from CAP (or the Colorado River).
- We have made improvements, but there is still work to do. In the 1950s approximately 70% of the water used in Arizona was groundwater and today it is only about 41%, but if we keep having droughts this can become a challenge.
Groundwater Activity:
Watch groundwater videos at least episodes 1 & 2
Exploration:
Pass out the Groundwater Diagram handout and have students work in small groups to label with words and arrows with as many parts and processes as they can. They shouldn’t forget the water cycle since groundwater is a part of the water cycle.
Review as a class by first asking: What do you see? What are the parts and processes you labeled?
Ideas should include in any order:
- Rain in the mountains.
- Runoff from the mountains enters the ground at the mountain-front recharge area.
- Groundwater moves towards the low point in the land surface.
- Do you see the dashed line labeled water table? What is that? The water table is the top surface of the groundwater, or the top of where the ground is fully saturated.
- What happens where the water table crosses the surface? There is surface water, river, lake or pond water.
- Wells pump water from the ground. What happens to the water table when groundwater is pumped? If we pump too much it can cause the water table to drop.
- What process do you think the arrows pointing up represent? Evaporation
- What do you think caused water to evaporate? The heat from the sun.
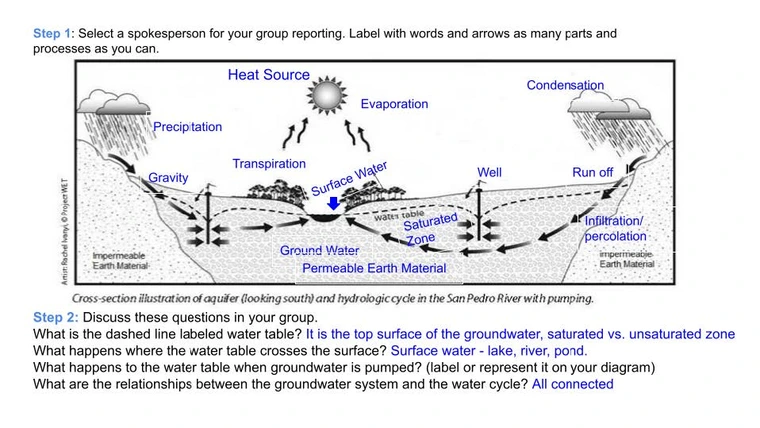
Ask: what are the relationships between the groundwater system and the water cycle? Groundwater is part of the water cycle because its water connects to the other natural places with water, such as lakes and soil. Groundwater is a source of water that can move throughout the water cycle.
Wrap-up:
Ask students: What have you learned about the relationships between groundwater and surface water? They are connected. Over-use of the groundwater can impact the river and the wells that supply people water in the watershed. How does drought, which is a natural occurrence in the Southwest, affect the availability of surface (river) water in relationship to the groundwater supply? It can make surface water dry up faster or reduce how much surface water we have to use, which means we have to use more groundwater as a supply for our needs. Is there anything we can do to help protect and conserve our groundwater? Yes, many things if we prevent pollution and make choices to conserve water. Can you be a groundwater guardian?
Make sure students label new parts and processes on their water cycle diagrams as well.
Other Resources:
- https://www.usgs.gov/special-topics/water-science-school/science/groundwater-information-topic
- https://asu.maps.arcgis.com/apps/dashboards/57696be87aac421f90ab2033807b7310
- Audubon Southwest - Understanding Arizona's Groundwater
- https://azwaterinnovation.asu.edu/rural-groundwater-resilience-toolkit/rural-groundwater-resilience-toolkit-learn-discover
My Water Footprint
Investigative Question:
• How much water do I use daily?
• Why is water use called a water footprint?
• How can I be a better water steward?
Engage: Students discuss and identify the difference between direct and indirect water use. In groups students explore how they use water in their daily lives and can examine local industries in Arizona to see how they use water. Students define the term water footprint and begin to create and describe their personal water footprint.
Reference: adapted from “Arizona Water Web” Part 1, Arizona Conserve Water Educator’s Guide, 2007, pg. 190-206 and “Virtual Water”, Project WET Curriculum and Activity Guide 2.0, 2011, pg. 289-296. Adapted from “My Water Footprint” Part 1, Foundations of Water Education, 2024, pg. 131-142.
Time Frame: 50 minutes
Cross Cutting Concepts Demonstrated:
- cause and effect
- systems and system models
- stability and change
- scale, proportion, and quantity
Science and Engineering Practices Integrated:
- develop and use models
- construct explanations and design solutions
Materials Needed:
- Direct and Indirect Water Use work sheet
- What's Your Water Footprint - Water Calculator
- How much water does it take to produce?
- My Water Footprint Student-Water-Use-Roles.pdf
- My Water Footprint Teacher-Lesson-Resources.pdf
- My-Water-Footprint-Daily-Use-Meter.pdf
- Student-Water-Sustainability-Worksheets.pdf
- Teacher-Water-Sustainability-Worksheets.pdf
Warm Up:
Use the slides above to introduce this lesson. Discuss with students: Direct and indirect water usage, what do you use water for? Have students quickly brainstorm a list of how they use water at home. Explain that these are direct uses of water. Then ask: What do you think is meant by the phrase: indirect use of water?
Investigation: (Optional)
Give each student a copy of the Direct and Indirect Water Use Worksheet. Using the information they discussed in the warmup, have students fill out Tables 1 and 2. (If students are not able to use the form, they can write answers in their notebooks.) Then students will read about some industries in Arizona and how they use water directly and indirectly. After, students should fill out Table 3 using that information. Have students discuss as a class what they learned about indirect water use in Arizona and how communities might reduce their water usage overall.
Or you can do either of these activities: From My Water Footprint pg. 131-142
Activity – Part 1:
- Pass out pieces of blank paper for students to trace their own footprints. The left foot and right foot should be traced on separate pieces of paper.
- Inside each footprint, draw a medium to large oval (see example).
- Cut out footprints and label them with the student’s name on the back. Collect the right footprints and save them for future use.
- Have students write down the direct ways they use water inside the circle on their left footprint. These will be the ways they directly touch or consumer water.
- This is their “water footprint”. Compare students’ water footprints.
- Does everyone have the same footprint? No, everyone has their own unique footprint.
- Would someone living in the desert use as much water (or use water the same as) as someone living in the tropics? Hopefully not.
- After students have completed writing the lists of items on their left footprints, collect all the footprints and display them, leaving room between them for the additions of the right footprint in the activity wrap up.
Activity - Part 2:
- Pass out Water Footprint Role to each student from the Copy Page – Water Use Roles
- Line up students at the end of a playing field, gym or classroom
- Read the scenarios on the Resource page – Water Footprint Scenarios. Students will move forward or backward depending on their role.
- After the game, distribute the right footprints to your students and ask them to write ideas on their footprints for using less water while still meeting their needs.
Wrap-up:
Continue to use slides to discuss the difference between water conservation and water efficiency and how we can use both to be water stewards.
- Discuss the population graph vs. water use graph and show that when we make good choices it does have an impact.
- Pass out water sustainability worksheets and have students work through them to demonstrate they understand water wise behaviors and sustainability actions.
Evaluate: Students brainstorm solutions (both behaviors and technologies) that can help to conserve and protect water. Standards-based assessment: 4.E1U2.10 Define problem(s) and design solution(s) to minimize the effects of natural hazards (in the context of droughts and water scarcity).